
Last week, I went over to Brown University for their annual Datathon. Several data sets were provided for data analysis, from reknowed organisatations such as Citizen’s Bank, Fidelity and Dassault System.
Given my recent interest in Geo-spatial data, my friend and I went with the data set provided by Citizen’s Bank, which consisted of the zip9 (zipcodes) within the United States, accompanied by financial, demographical information and number of home buyers within each zip9. Our goal for the 24 hours we had, was to analyse and predict the number of home buyers for the next 3 months. Naturally, I started with looking at if there were correlations between the number of home loans, with any of the financial information for a given zip9. However, to our surprise the correlations were all exceedingly low, and hence even if we had used all the variables in a machine learning model, the results would not be accurate. Our approach then was to then analyse the data geographically, and we decided to plot the number of home buyers
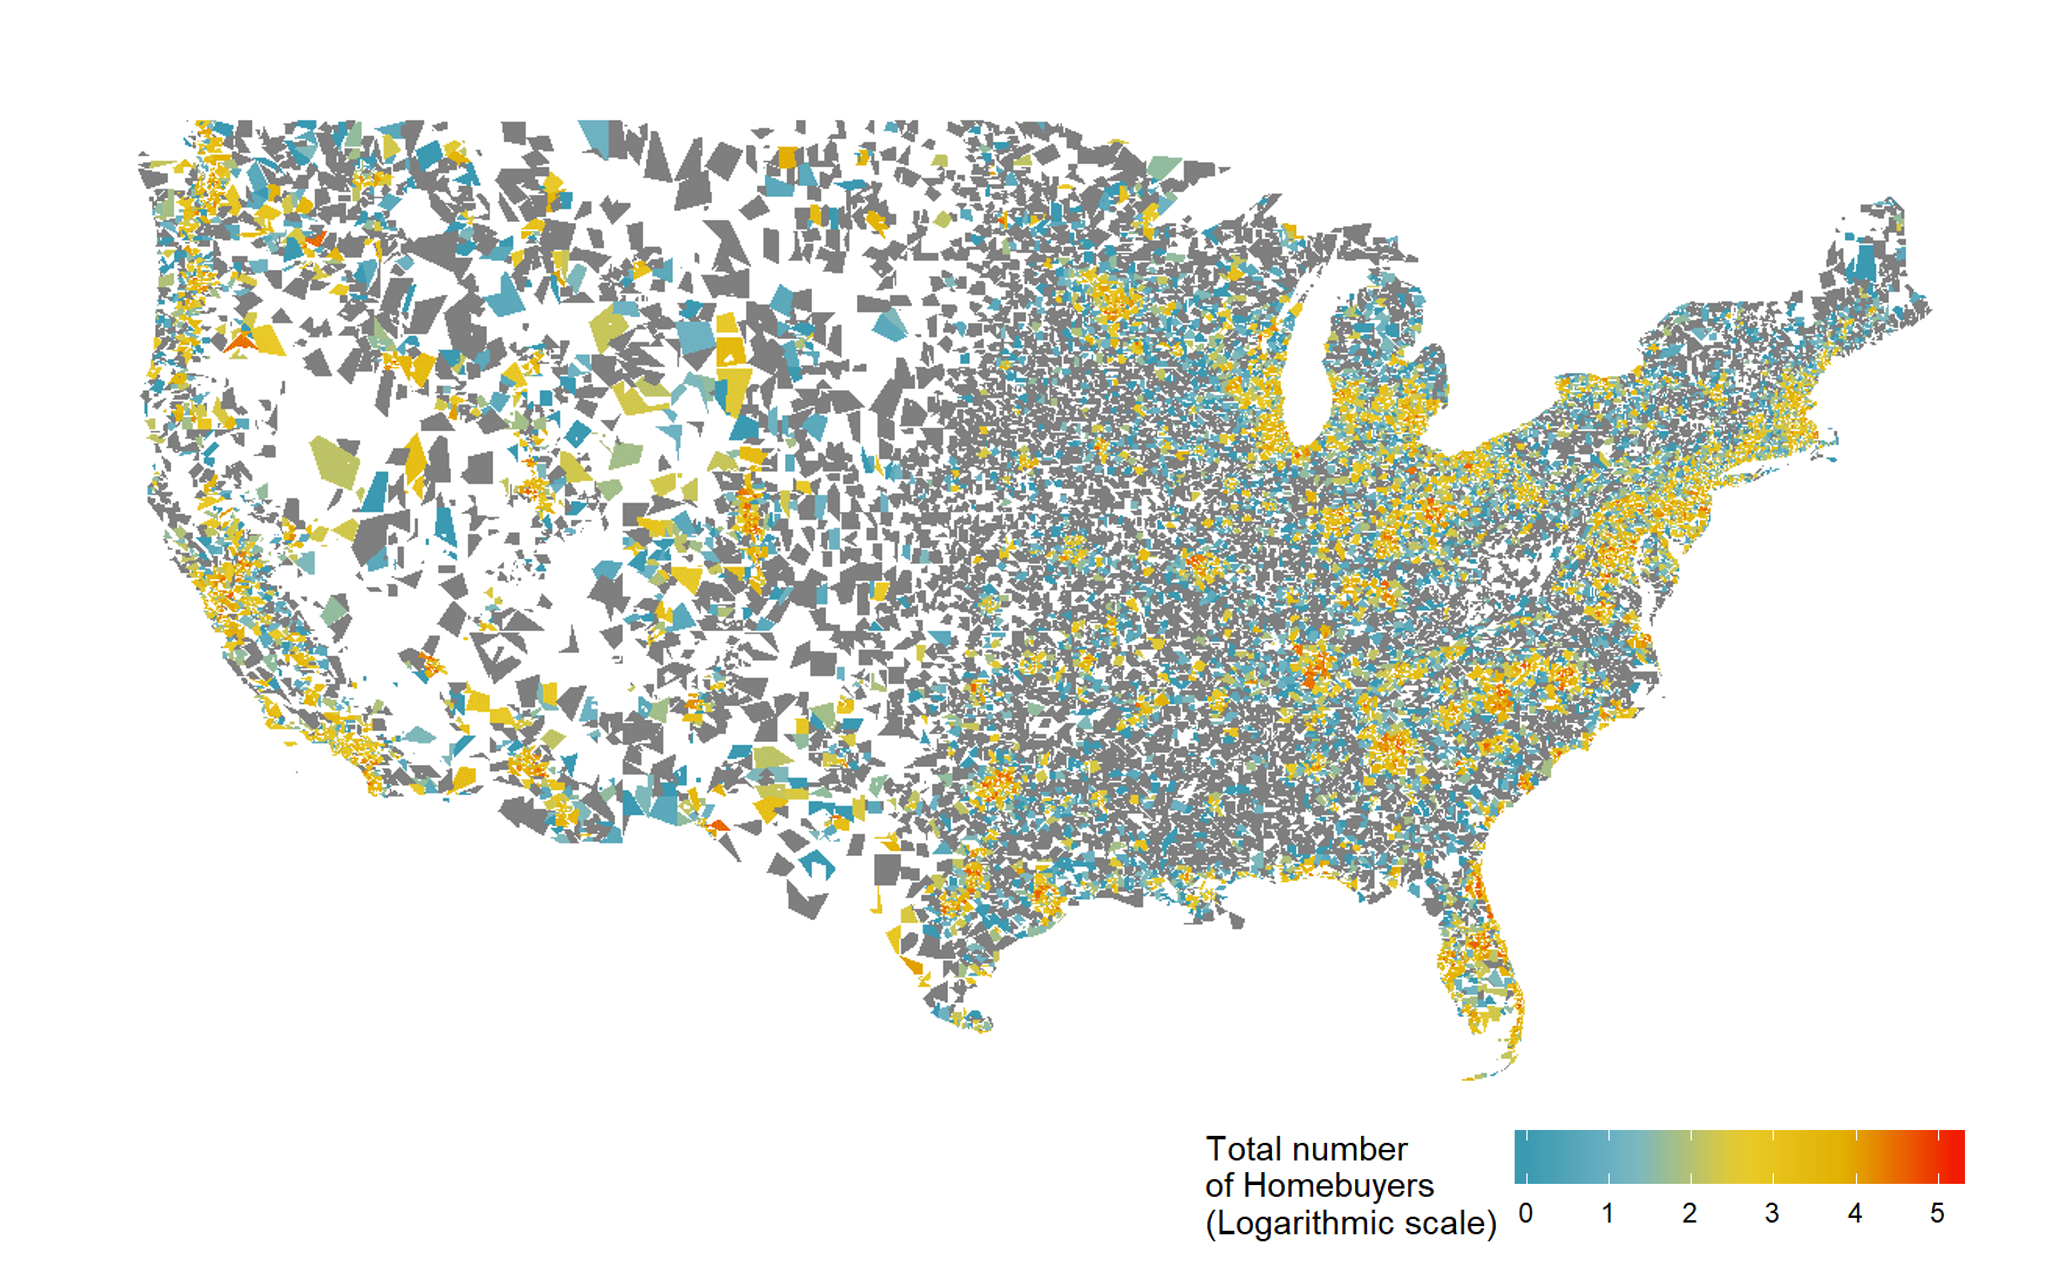
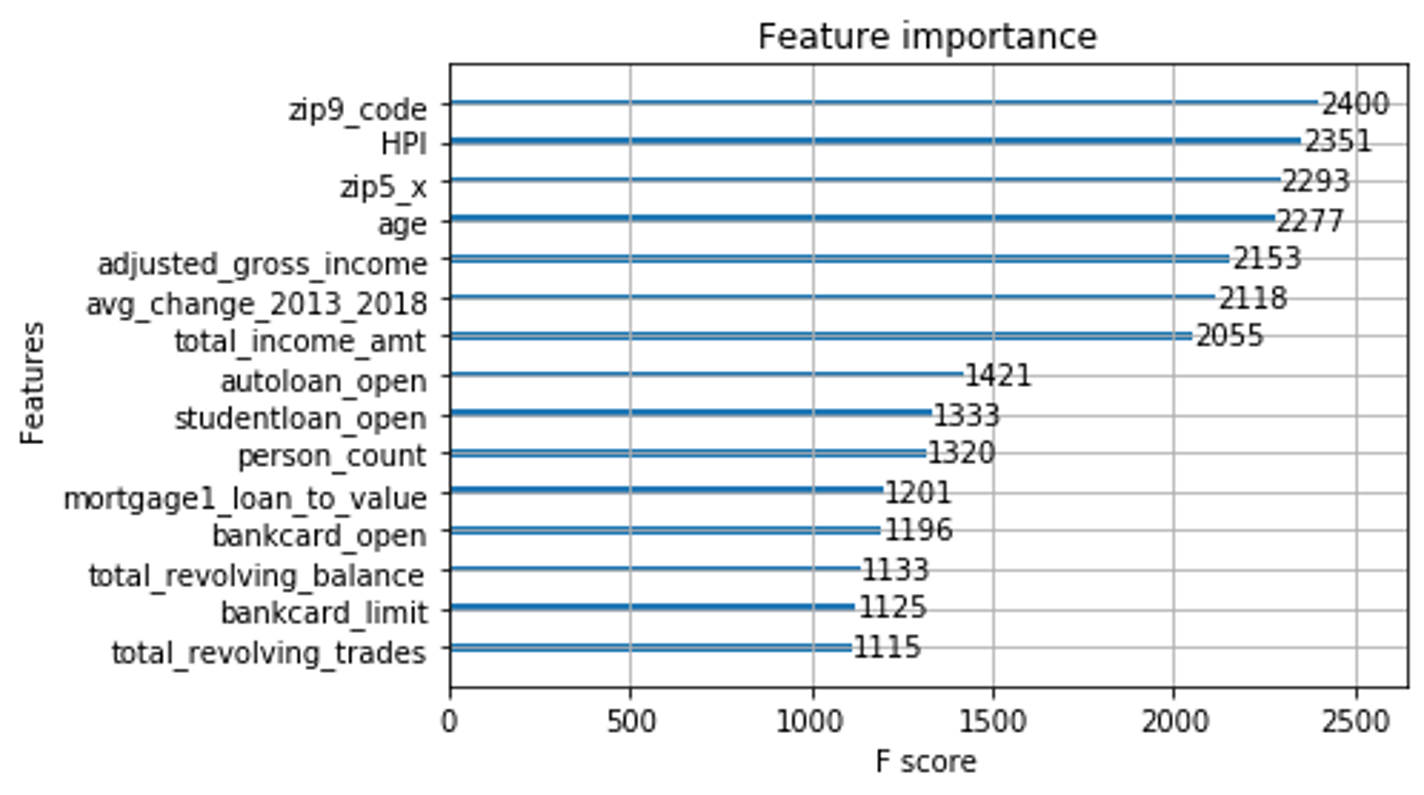
It was interesting because this would suggest that there could be spatial correlation in the data, where the number of homebuyers in a particular zip9 is correlated with the number in the surrounding zip9s. Subsequently, this inspired us to add in other variables into the data for prediction, such as the average income in a particular zip5 (zip codes but on a larger scale), and the housing price index. Subsequently, modelling the number of home buyers via XGBoost showed a significant improvement, and the results of feature importance did indeed show that these variables were much more important in predicting the number of homebuyers than financial information.
Overall, running a sample of the data set produced decent results, with an accuracy of 95.5%.

Notes:
- Our presentation can be found on Google Slides!